Configuring your own MQTT broker with a database offers significant cost advantages over cloud IoT platforms like AWS or Azure. You eliminate recurring service fees, unpredictable pricing tiers, and data egress costs. Hosting on-premises or on a low-cost VPS ensures a predictable and lower total cost of ownership, especially for scaling needs.
Self-hosted solutions provide full customization, allowing you to optimize message retention, QoS, and security without premium charges. Direct integration with your database avoids extra pipeline costs, while local data control enhances privacy and compliance.
Unlike proprietary platforms, self-hosting prevents vendor lock-in, offering greater flexibility to adapt or migrate as needed. Open-source brokers like RabbitMQ deliver robust functionality for free, making this approach ideal for long-term, cost-effective IoT deployments.
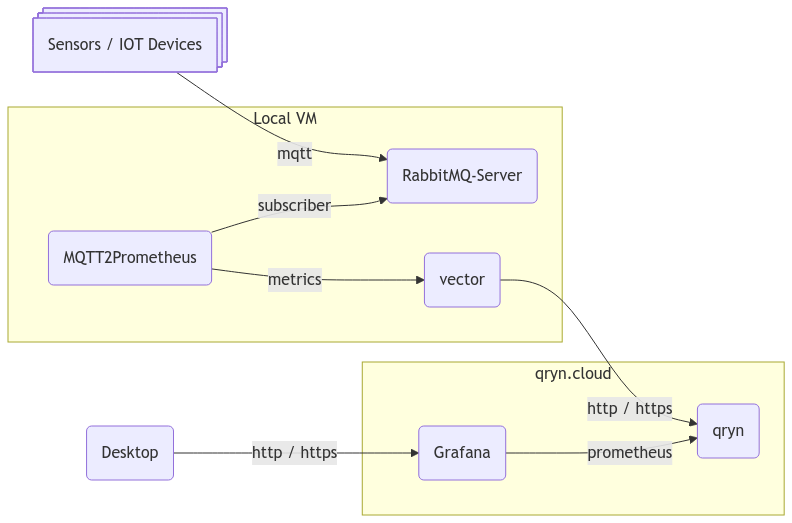
Here is my little effort to create onsite or make your own cloud solution for IOT using qryn.
Use this link to install qryn or you can also use qryn.cloud.
Install rabbitmq server
aptitude install rabbitmq-server
systemctl status rabbitmq-server
Install mqtt plugin
rabbitmq-plugins enable rabbitmq_mqttInstall managemnet plugin
rabbitmq-plugins enable rabbitmq_managementYou can alos list the aviableable plugins and install if required
rabbitmq-plugins liststart and enable rabbitmq server
systemctl restart rabbitmq-server
systemctl enable rabbitmq-server
Add Admin User to login in admin portal
rabbitmqctl add_user hamid
rabbitmqctl set_permissions -p "/" "hamid" ".*" ".*" ".*"
rabbitmqctl set_user_tags hamid administrator
some optional commands
rabbitmqctl list_users
rabbitmqctl list_vhosts --silentInstall Golang with the following steps
cd /usr/local/src/
wget https://go.dev/dl/go1.21.5.linux-amd64.tar.gz
rm -rf /usr/local/go && tar -C /usr/local -xzf go1.21.5.linux-amd64.tar.gz
export PATH=$PATH:/usr/local/go/bin
cd
go version
now compile mqtt2prometheus1.
git clone https://github.com/hikhvar/mqtt2prometheus
cd mqtt2prometheus
make
cp mqtt2prometheus /usr/bin/
mkdir /etc/mqtt2prometheus
cp config.yaml.dist /etc/mqtt2prometheus/config.yaml
start mqtt2prometheus to start converting mqtt data to prometheus metrics23
mqtt2prometheus -config /etc/mqtt2prometheus/config.yamlvim /etc/systemd/system/mqtt2prometheus.serviceCopy the following lines to mqtt2prometheus.service file
[Unit]
Description=Converts mqtt data to prometheus metrics
After=network.target

[Service]
ExecStart=/usr/bin/mqtt2prometheus -config /etc/mqtt2prometheus/config.yaml
ExecStop=/bin/kill ${MAINPID}
Restart=on-failure
RestartSec=10s
Type=simple

[Install]
WantedBy=multi-user.target
start server
systemctl daemon-reload
systemctl start mqtt2prometheusInstall Vector using following commands
bash -c "$(curl -L https://setup.vector.dev)"
apt-get install vector
create vector configuration file
vim /etc/vector/mqtt.tomlcopy the following configuration in mqtt.toml file
[sources.mqtt_scrape]
type = "prometheus_scrape"
endpoints = [ "http://mqtt.hbvoice.local:9641/metrics" ]
scrape_interval_secs = 5
instance_tag = "mqtt2prometheus"
endpoint_tag = "mqtt"

[sinks.prom_write]
type = "prometheus_remote_write"
inputs = [ "mqtt_scrape" ]
endpoint = "http://qryn.hbvoice.local:3100/prom/remote/write"
Now start vector
vector --config.toml /etc/vector/mqtt.toml -t 5For Testing Use Mosquitto Client
aptitude install mosquitto-clients
mosquitto_pub -h 127.0.0.1 -p 1883 -t "v1/devices/me/1234" -m '{"temperature": "38"}'
for longer testing, I used the following script
#!/bin/bash
TEMP=`echo $((20 + $RANDOM % 5))`
HUMIDITY=`echo $((60 + $RANDOM % 10))`
JSON_STRING='{"temperature": "'$TEMP'", "humidity": "'$HUMIDITY'"}'
echo $JSON_STRING
mosquitto_pub -h 127.0.0.1 -p 1883 -t "v1/devices/me/1235" -m "$JSON_STRING"

TEMP=`echo $((20 + $RANDOM % 10))`
HUMIDITY=`echo $((60 + $RANDOM % 15))`
JSON_STRING='{"temperature": "'$TEMP'", "humidity": "'$HUMIDITY'"}'
echo $JSON_STRING
mosquitto_pub -h 127.0.0.1 -p 1883 -t "v1/devices/me/1234" -m "$JSON_STRING"

TEMP=`echo $((20 + $RANDOM % 15))`
HUMIDITY=`echo $((70 + $RANDOM % 20))`
JSON_STRING='{"temperature": "'$TEMP'", "humidity": "'$HUMIDITY'"}'
echo $JSON_STRING
mosquitto_pub -h 127.0.0.1 -p 1883 -t "v1/devices/me/12346" -m "$JSON_STRING"
and run it with the following command
chmod +x mqtt_test_data.sh
watch -n 6 ./mqtt_test_data.shapt-get install -y apt-transport-https software-properties-common wget
mkdir -p /etc/apt/keyrings/
wget -q -O - https://apt.grafana.com/gpg.key | gpg --dearmor | sudo tee /etc/apt/keyrings/grafana.gpg > /dev/null
echo "deb [signed-by=/etc/apt/keyrings/grafana.gpg] https://apt.grafana.com stable main" | sudo tee -a /etc/apt/sources.list.d/grafana.list
Updates the list of available packages
sudo apt-get update
Installs the latest OSS release:
sudo apt-get install grafana
systemctl daemon-reload
systemctl enable grafana-server
systemctl start grafana-server
Access Grafana UI with the following URL
Username: admin
Password: admin
Now add a new data source
Open Menu --> Connections --> Data Source --> Click "Add New Data Source" --> Select "Prometheus"
Basic Auth
Username: default
Password: Clickpass
Click "Save and test"
Download Dashboard using this link and import it in Grafana

